Your BI Vendor Sold You 47 Dashboards. Reporting Is Something Else.
Your COO opens Looker Monday, 47 dashboards live, three exec inboxes waiting on the Q3 narrative. A dashboard is not a reporting function.

It is Monday, September 14, 8:12 AM. Your COO opens Looker. 47 dashboards live across the workspace. 6 of them load past the 15-second render budget. 3 of them run against a dbt model that broke over the weekend and returned nulls on 14 metric tiles. The exec inbox is waiting on the Q3 narrative document that was due at 9 AM Friday. The CFO already sent two Slack pings asking for the revised gross margin walk. The COO opens a blank Google Doc and starts writing the narrative from scratch against the tiles she trusts.
The BI vendor sold you a reporting stack. What you bought was a dashboard rendering engine with a query planner and a permissions layer. Reporting is the thing a human does with the numbers once the tiles have rendered. It is a function. It has a cadence, an owner, a stakeholder list, a distribution channel, and a follow-up loop. Your BI stack does not run a cadence, does not own the narrative, does not read the anomaly, and does not chase the department head who missed the input deadline. Your COO does. On a Monday morning. Before her first meeting.
What a dashboard is
A dashboard is a saved query with formatting on top. It renders a tile against a data model on a cadence the user sets. It does not decide which tiles matter this quarter. It does not read the tile and write the sentence that goes above it in the exec digest. It does not open a Slack thread with the RevOps analyst when the pipeline coverage tile drops 14 percent week over week. It does not chase the finance team for the accrual adjustment that closed on the 8th and did not flow into the dashboard until the 11th.
Your Looker instance has 47 dashboards. Your Metabase workspace has 84 saved questions. Your Tableau server has 22 published workbooks. Not one of them wrote a sentence this quarter. The Head of Data set up the alert for the pipeline coverage tile in April. It fires every Wednesday at 6 AM into a channel with 34 people in it. Nobody replies. The tile ran red for eleven weeks before the CRO noticed on the QBR.
What a reporting function does
Reporting reads the tiles, writes the narrative, distributes it to a defined stakeholder list, and chases the anomalies. It runs on a cadence. Weekly for pipeline and cash. Monthly for the exec digest and the investor update. Quarterly for the board deck. Every cadence has an owner, a source list, a template, a stakeholder distribution, and a follow-up window.
The Monday exec digest reads pipeline coverage, top three deals slipping, net new ARR week to date, cash burn against plan, product usage of the top ten accounts, support tickets past SLA, and hiring pipeline against plan. Seven inputs. Seven owners. Seven source systems. One narrative document distributed to eight people by 9 AM. A dashboard renders one of those inputs. A reporting function assembles all seven, writes the two sentences above each tile, flags the two anomalies that need a decision this week, and drops the doc in the exec channel with the three questions the CEO should open Tuesday's staff meeting with.
Why hiring a BI analyst does not fix this
The textbook fix is a Senior BI Analyst at $140K to $180K loaded, or a Head of Data Analytics at $220K to $310K. Both spend the first 90 days rebuilding the dbt models, cleaning the metric layer, and shipping a fresh dashboard suite against the exec priorities. Neither writes the Monday narrative. Neither chases the finance accrual. Neither reads the pipeline tile Wednesday morning and pings the CRO with the two deals to intervene on.
You get more dashboards. You get better dashboards. You do not get a reporting function. The COO still opens a blank doc Monday morning. The narrative is still a person reading tiles and writing sentences. The stakeholder distribution is still a Slack copy-paste. The follow-up loop is still an inbox chase. The tools got sharper. The function stayed empty.
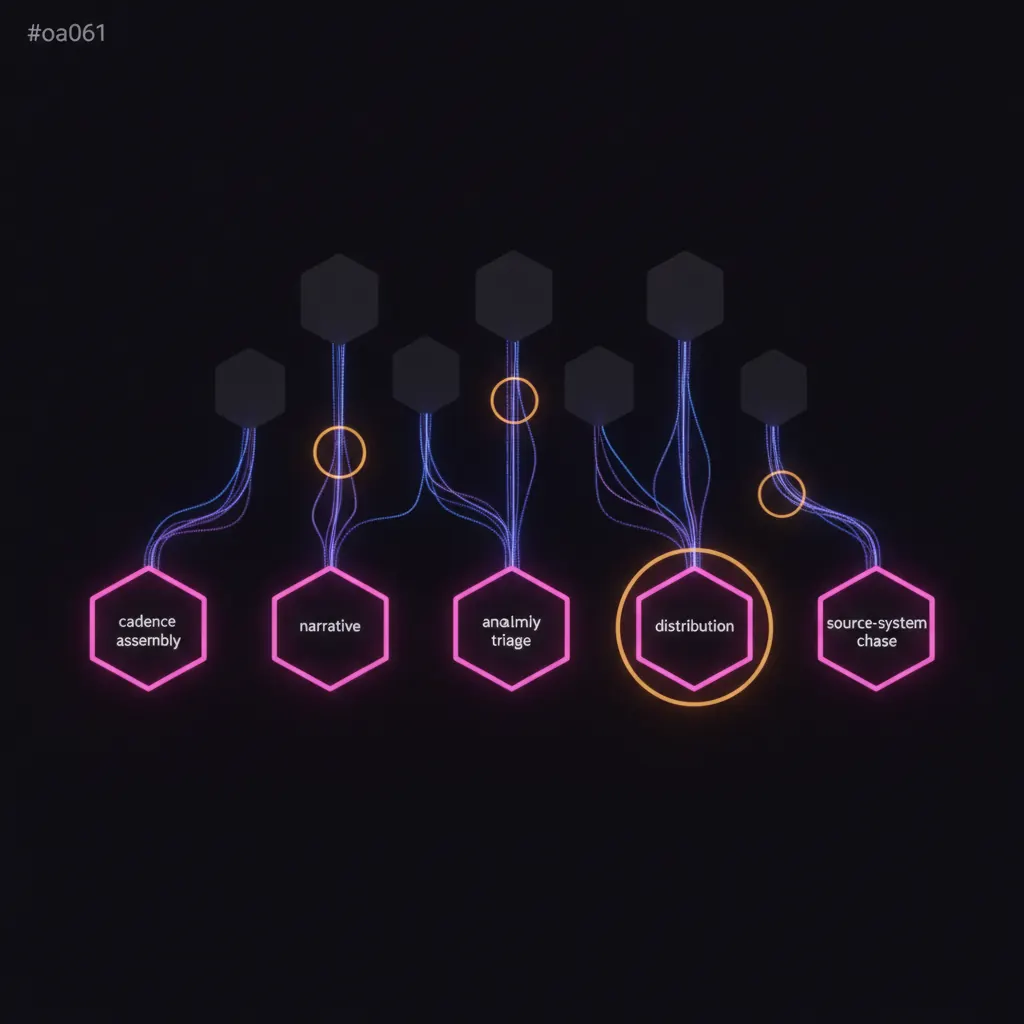
The five things a reporting function owns that a dashboard cannot
Cadence assembly. The Monday digest, the Friday cash flash, the monthly exec review, the quarterly board deck. Each pulls from a defined source list, waits for the finance close and the RevOps refresh, and lands in the stakeholder inbox on the calendar committed to the exec team.
Narrative writing. Every tile gets two to four sentences above it that read the number, compare it against plan and against the trailing period, name the driver, and flag the decision the tile is asking the reader to make. The CFO stops rewriting the gross margin walk on Sunday night.
Anomaly triage. Every metric outside a defined threshold fires a Slack thread to the named owner with the tile, the source query, the trailing four periods of context, and a drafted question for the review meeting. The pipeline coverage tile never runs red for eleven weeks in silence.
Stakeholder distribution. The Monday digest reaches the eight people on the exec list at 8:45 AM. The investor update reaches the twelve LPs by the 8th. The board pre-read reaches the seven directors seven days before the meeting. The distribution list has a source of truth and the follow-up chase runs on cadence.
Source-system chase. The finance accrual closes on the 8th. The RevOps refresh runs Sunday night. The product analytics ETL breaks the second Wednesday of the month at 4 AM. A reporting function knows the failure calendar and chases the fix before the digest ships, not after the CEO asks why the numbers look off.
The unit economics of a reporting function
Path A hires a Senior BI Analyst at $160K loaded, a Manager of FP&A at $190K loaded, plus $2,400 monthly on the analytics stack expansion. Year one lands $380K to $440K. Two humans covering seven cadences across seven source systems on a stakeholder list of thirty. The narrative still gets drafted the night before. Anomaly triage still runs on ad-hoc Slack pings. Half the digest quality lives in one BI analyst's memory of which tile broke last quarter.
Path B runs a 14-day sprint to stand up a fractional reporting agent against the seven cadences at low to mid five figures, then runs at $4K to $8K a month on API spend and tooling, plus a fractional reporting operator at $4K to $6K a month who owns the exception loop and the narrative review. Year one lands $130K to $190K. The Monday digest ships at 8:45 AM without a human opening a blank doc. Every anomaly fires a Slack thread with the source tile and the trailing periods attached. The board pre-read ships seven days before every meeting.
Two case studies on the site walk the shape of that trade on a similar exec stack.
What changes after the sprint
Picture the same Monday, 8:12 AM. Your COO opens Slack instead of Looker. The Monday exec digest already landed in the channel at 8:45 AM Friday. Seven tiles, seven narratives, two flagged anomalies, three drafted questions for the staff meeting. The CFO's gross margin walk shipped at 6 AM Sunday. The pipeline coverage anomaly from Wednesday already has a resolution note from the CRO attached.
The 47 dashboards are still live. The BI stack still renders the tiles. The difference is that a function reads the tiles, writes the narrative, chases the source systems, and distributes the doc on a cadence the exec team can build a week around. The COO stops running reporting from her inbox on Monday morning. The BI vendor keeps sending the renewal invoice. Reporting keeps shipping without her.
If your COO is writing the Monday digest from scratch this week, the version where the digest lands in the exec channel at 8:45 AM Friday is fourteen days away. Dashboards are a rendering layer. Reporting is a function. You can hire against it, keep drafting the narrative on Sunday night, or scope a sprint and read the first digest at your kitchen table next weekend.
 2026-09-06
Your FP&A Model Has 34 Tabs and the CFO Rebuilds Q4 Forecast Every Friday Night
Your CFO opens the model Friday at 8:14 PM, 34 tabs, six broken links, 47 assumption cells hardcoded last quarter. A queue nobody staffed.
 2026-09-05
Your Product Analytics Tracks 340 Events and PMs Open Mixpanel Twice a Month
Your PM opens Mixpanel Thursday, 340 tracked events firing, two dashboards bookmarked, last query ran August 14. A queue nobody staffed.
 2026-09-03
Your Q3 Board Deck Took 47 Hours to Build and Three Slides Shipped With Stale Numbers
Your COO opens the board folder Monday, 47 hours of exec assembly across four functions, three slides carrying August numbers. A queue nobody staffed.