Your FP&A Model Has 34 Tabs and the CFO Rebuilds Q4 Forecast Every Friday Night
Your CFO opens the model Friday at 8:14 PM, 34 tabs, six broken links, 47 assumption cells hardcoded last quarter. A queue nobody staffed.

It is Friday, September 4, 8:14 PM. Your CFO opens the Q4 forecast model. The workbook shows 34 tabs across revenue, headcount, cash, cohort retention, expansion, gross margin, and eight departmental OpEx sheets. Six named ranges throw #REF errors. 47 assumption cells were hardcoded on August 3 by the FP&A analyst who left in June. The bank feed reconciliation tab last refreshed August 18, three weeks stale against a stated weekly cadence.
The board meeting is Tuesday. The CFO opens Slack, drops a line to the Head of FP&A that reads "pulling Q4 tonight, will send by Sunday." Same message shipped in June, in March, in December. The Q4 forecast the board will read on Tuesday is a $28M ARR company's most-cited number, and it is being rebuilt by one person on a Friday night against a workbook nobody staffed end to end.
Pull the trailing four quarters. Count the forecast versions that landed inside a 5 percent variance of actuals. Most Series B books count one in four. Count the hours the CFO, the Head of FP&A, and the analyst pool spent inside the workbook rebuilding the same tabs. Most count 40 to 70 a quarter across three people. Forecasting is not a modeling problem. Forecasting is a queue.
The 34 tabs nobody owns
Walk the workbook. Revenue lives on tab 4, pulled from a Stripe export dropped in on the 3rd of each month. Headcount lives on tab 9, pulled from BambooHR by copy-paste every second Monday. Cash lives on tab 14, tied to a Mercury CSV the controller downloads Friday afternoon. Cohort retention lives on tab 19, a manual pivot off the warehouse the analyst rebuilt in April. OpEx sits across tabs 22 through 30, one per department, each tied to a monthly close file the accounting team lands on day 8.
Six of the 34 tabs feed the master summary tab that produces the number the CFO sends the board. Named ranges break every time the accounting team adds a GL account. Assumption cells get hardcoded when the model breaks under a scenario the CEO asked for on a Wednesday and the analyst never rewired. The staff engineer who scoped the warehouse ETL in Q1 built the pipeline that should have fed the workbook, and the workbook still eats a CSV drop because nobody wired the last mile from the warehouse to the model.
The team that should own this knows it is broken. The Head of FP&A ships a Monday variance report that closes to actuals four weeks late. The controller runs close in eight days and hands off a locked trial balance. The analyst on the growth pod pulls a query on Thursday to feed the retention tab. Three people touch the workbook in a given week and none of them own the queue end to end. The 34-tab model is a $220K sunk cost in analyst salary and a $340K sunk cost in every quarter the forecast lands outside the variance window.
Hiring a Head of FP&A is the slow answer
The textbook fix is a Head of FP&A, a Senior FP&A Analyst, or a fractional finance operator with a variance number on the scoreboard. Loaded comp in the US runs $180K to $260K a year for the senior analyst, $240K to $340K for the head-of, with a recruiter fee at 22 percent of first-year cash landing another $50K on the ledger. Months one through three go to rewriting the model, killing the hardcoded assumption cells, and wiring the departmental OpEx tabs to the close file. Months four through nine are when forecast accuracy moves from one-in-four inside a 5 percent variance to three-in-four, cash runway confidence tightens, and the CFO stops rebuilding Q4 on a Friday night.
The fractional version is faster and stops at the same wall. Eight to twelve thousand a month buys twelve to sixteen hours a week of senior FP&A work. The first month rebuilds the master summary tab and ties three departmental sheets to the close file. The 34-tab workbook keeps drifting because a fractional analyst cannot refresh every departmental OpEx sheet on the day the close lands, rewire every broken named range as the GL evolves, rebuild every cohort retention pivot against the warehouse each week, refresh the cash tab on the bank feed every morning, and draft the board narrative against six scenarios the CEO asked for on a Wednesday.
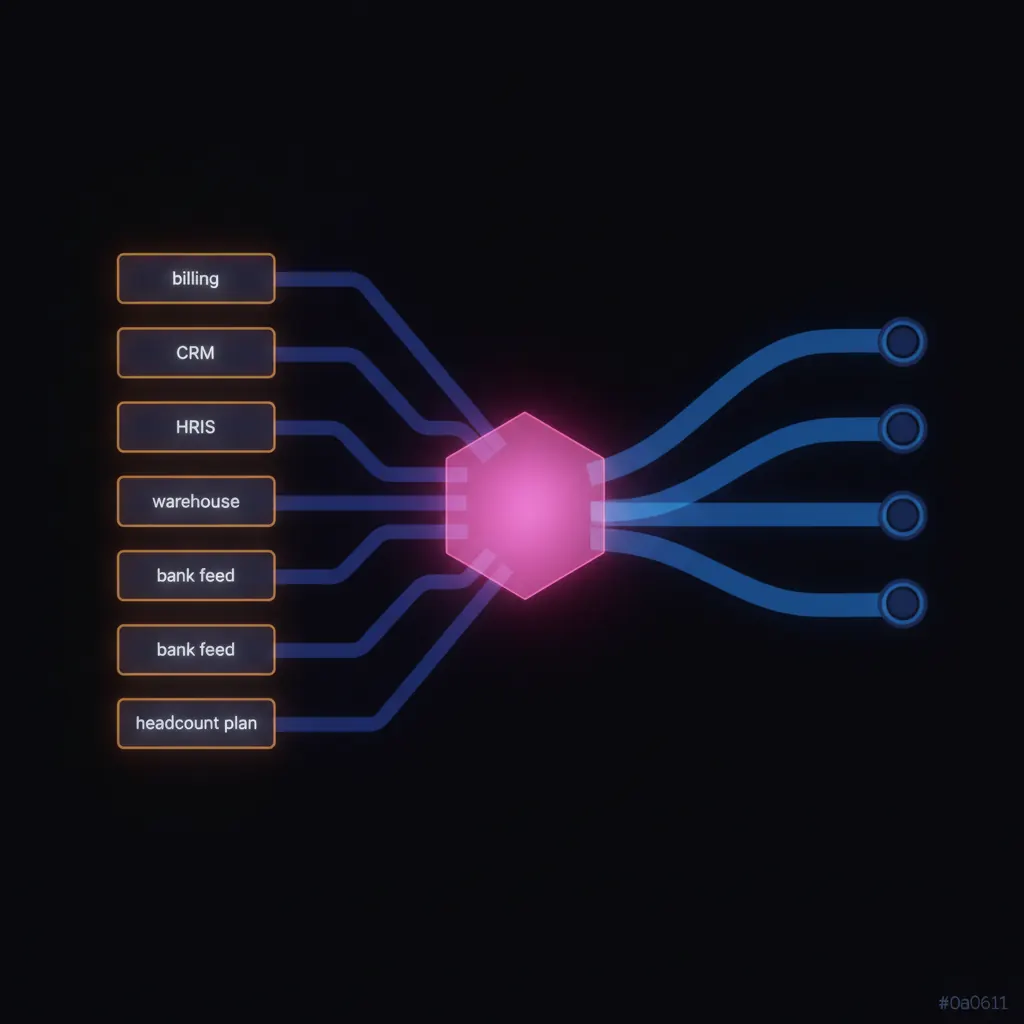
Both versions assume the work is a person opening a workbook on a cadence. The work itself is watching the close file land on day 8 and refreshing eight OpEx tabs against it, joining the Stripe billing feed to the deferred revenue schedule and the retention cohort by tier, refreshing the headcount plan against the ATS offer pipeline and the terminated-employee log from HRIS, refreshing the cash tab against the bank feed every morning, running six scenarios the CEO asked for by Tuesday, drafting the variance narrative against the trailing four quarters, and shipping the board-ready deck section by Monday morning. On 34 tabs, six source systems, and eight departments that is 45 to 60 hours a week of senior finance work. No single hire clears the pile and holds the variance number at the same time.
What a fractional AI FP&A function owns
Hand the general ledger, the close file, the Stripe billing feed, the Mercury bank feed, the BambooHR headcount data, the ATS offer pipeline, the warehouse retention tables, the departmental OpEx budgets, the trailing four quarters of forecast versions, and the board narrative template to a fractional AI agent. The agent does the work a Head of FP&A, a Senior Analyst, and a controller pod would do together. The cadence is per-morning on cash, per-day on billing, per-close on OpEx, per-week on retention and headcount, per-board on the narrative.
Every morning on cash. The bank feed lands at 6:00 AM. By 6:47 AM the cash tab refreshes, the runway calculation updates against the current burn, and the CFO reads a two-line Slack digest with the closing balance, the trailing 30-day burn, and the runway months against the current plan. The Friday-afternoon cash reconciliation stops eating the controller's week.
Every day on billing. The Stripe feed refreshes hourly. The revenue tab updates against MRR, ARR, new logo, expansion, and contraction on a daily grain. The Head of FP&A opens the model on Wednesday and reads a current month-to-date number instead of an August 3 snapshot.
Every close on OpEx. The accounting team lands the close file on day 8. By day 8 at 4:00 PM the eight departmental OpEx tabs refresh against the trial balance, the variance report ships to each department lead, and the exception queue names the four accounts running 15 percent above plan with the vendor, the invoice, and the accrual pattern attached.
Every week on retention and headcount. The warehouse retention query runs Monday morning. The cohort tab refreshes against the current customer base by tier. The headcount tab refreshes against the ATS offer pipeline and the HRIS termination log. The Q4 plan updates against the current fully-loaded cost per hire and the current attrition run rate.
Every board cycle on the narrative. The forecast model produces six scenarios by Monday at 9:00 AM ahead of a Tuesday board. The variance narrative names the three drivers of the miss, the two drivers of the beat, and the one assumption the CEO asked for that broke the base case. The CFO opens the deck section on Monday and edits copy instead of rebuilding the tab.
The unit economics of a forecast that missed by 12 percent
A Series B company at $28M ARR running a three-person finance pod against a 34-tab workbook is burning three specific things. The CFO, the Head of FP&A, and the senior analyst spend a combined 28 to 42 hours a week rebuilding tabs, chasing named ranges, and running scenarios against a fully loaded hour of $190 to $310. That is $21K to $52K a month of senior finance time on work a live model clears. The finance pod gets six to nine hours a week back inside the first sprint.
The forecast line is the second one. A Q4 forecast that lands 12 percent under actuals commits the wrong hiring plan, the wrong quota load on the sales bench, and the wrong ad budget on the demand pod. Moving forecast accuracy from one-in-four inside a 5 percent variance to three-in-four across two quarters compounds against the operating plan on eight departments and a $6M to $10M quarterly OpEx. The one quarter the plan gets recut early because the variance signal fired on day 12 instead of day 45 pays for the sprint and the ongoing spend twice over.
The board line is the third one. A board meeting where the CFO walks in with a forecast rebuilt on Friday night and a variance narrative written on Sunday costs the CFO the room. Board confidence in the number is a compounding asset priced into every downstream conversation: the next round, the credit facility, the RSU refresh, the auditor relationship. A 14-day sprint to stand up the agent runs in the low to mid five figures. Ongoing cost lands closer to two Datarails seats than a Head of FP&A hire. The cash refresh, the billing feed, and the master summary rewire ship in week one. The OpEx close routing, the retention pivot, and the headcount plan ship in week two. The variance narrative engine ships off the live model before the sprint closes.
What changes after the sprint
Picture the same Friday, 8:14 PM moment, thirty days after the sprint ships. Your CFO is not in the workbook. The Q4 forecast refreshed on Tuesday at 6:47 AM against the close file. The variance narrative landed on the CFO's desk Monday at 9:00 AM naming the three drivers of the September miss, the one assumption the CEO asked for that broke the base case, and the four OpEx accounts running above plan. The Head of FP&A opens the model on Wednesday and edits the narrative copy for the board deck section instead of rebuilding tab 22.
By Tuesday the board reads a forecast inside a 4 percent variance to trailing actuals, a scenario table with six lines instead of two, and a runway number the CFO can defend against the current burn and the current pipe. The controller closes on day 6 instead of day 8 because the OpEx exception queue clears in a day instead of a week. The senior analyst spends her Tuesday drafting the pricing tier scenario the CEO asked for on a Wednesday instead of chasing a broken named range on tab 19.
If your Q4 forecast currently gets rebuilt on a Friday night, and the last three variance reports landed outside a 5 percent window against actuals, the version where the model refreshes on a live feed and the CFO reads a variance narrative before the board opens is fourteen days away. FP&A is a function. You can hire against it, you can retain a fractional operator for it, or you can scope a sprint and have it running this month. The 34 tabs are already built. The math is whether the number gets rebuilt every Friday or refreshed every morning.
 2026-10-18
Your Jira Is Not Product Management
Jira stores 4,200 tickets. Product management is the function that keeps the 94 that move the roadmap closing on cadence with scope cuts on the ledger.
 2026-10-17
Your Zapier Is Not Automation
Zapier runs 420 Zaps. Automation is the function that keeps the 94 that move revenue firing on cadence with error routing and ROI on the ledger.
 2026-10-16
Your Notion Is Not Knowledge Management
Notion stores 1,840 pages. Knowledge management is the function that keeps the 94 pages your team reads this quarter accurate on cadence.